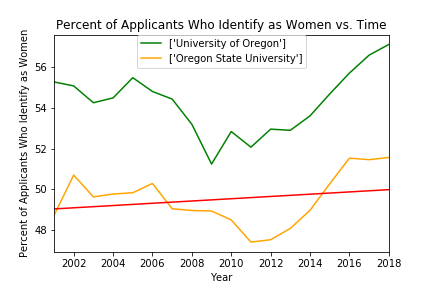
University of Oregon
and
Oregon State University

In this figure, we can see that there have been some larger fluctuations in percent of applicants that identify as women, especially between 2006 and 2016. The red line represents the regression analysis performed in the original code. For this graph:
The slope of the line is ~0.055
The correlation coefficient is ~0.231
This suggests a weak positive correlation between the percent of applicants that identify as the years progresssed in this time-frame.


