Summary: All Pac-12 Universities
This webpage was built as a submission for the Web Design unit of the University of Oregon Bootcamp. The raw data used can be found on the Data page. I was interested in this data while looking through admissions vs. tuition data as part of a group project earlier in this course. After determining the supplied weather data was unmotivating at best, I decided to dig up the visualizations I had begun working on during that project, and dive further into those instead.
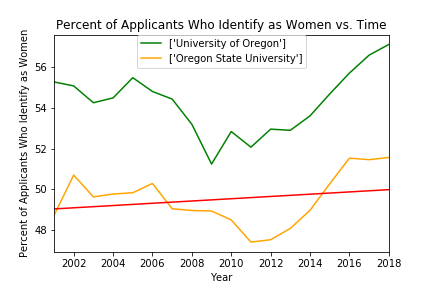
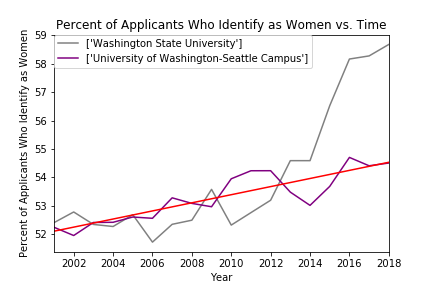
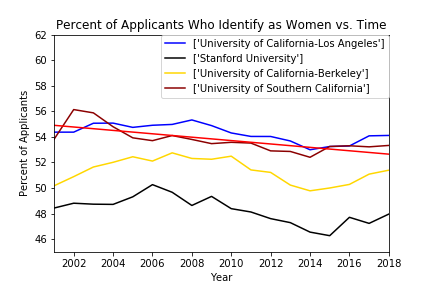
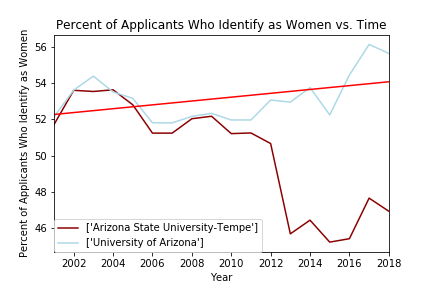
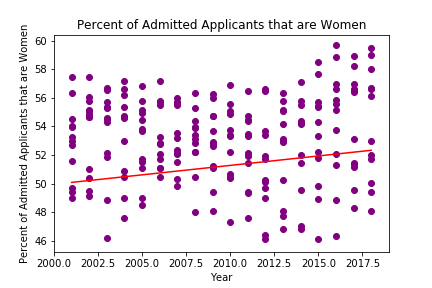
The above figure was plotted each University and each year evaluated (2001-2018). I used the number of applicants that identify as women divided by total number of admitted applicants, and multiplied that number by 100 to find percent of admitted applicants who identify as women. For this graph:
The slope of the line is ~0.132
The correlation coefficient is ~0.523
The best fit line on this figure suggest a weak positive correlation over time.
Note that there were 12 universities over 17 years which contributed 215 data points to this plot. I omitted the Universities in Utah and Colorado to maintain a more even looking grid for the other visualizations throughout the site. In the other visualizations, I looked at percentage of applicants, rather than percentage of admitted students.
