California Pac-12 Universities

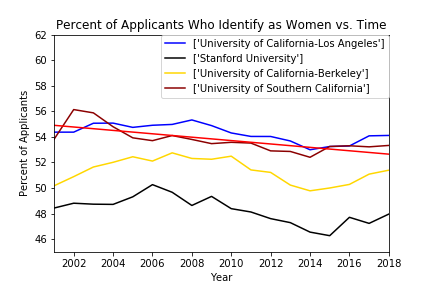
In this figure, it appears the percent of applicants that identify as women has remained somewhat similar over time, and Stanford has consistently maintained a significantly lower percentage of women applicants throughout this time frame. The red line represents the regression analysis performed in the original code. For this graph:
The slope of the line is ~ - 0.133
The correlation coefficient is ~ - 0.734
This suggests a negative correlation between the percent of applicants that identify as the years progresssed in this time-frame.


